Image courtesy Associated General Contractors of America (AGC)
Bid and input prices for construction showed mixed monthly and year-over-year patterns in February, according to an analysis by Associated General Contractors of America (AGC) of U.S. Bureau of Labor Statistics (BLS) data. The producer price index (PPI) for material and service inputs to new nonresidential construction rose 0.9 percent, not seasonally adjusted (NSA), for the second month in a row and 2 percent year over year. The PPI for new nonresidential building construction—a measure of prices that contractors say they would bid to erect a fixed set of buildings—was flat in February, and fell 1.2 percent year over year.
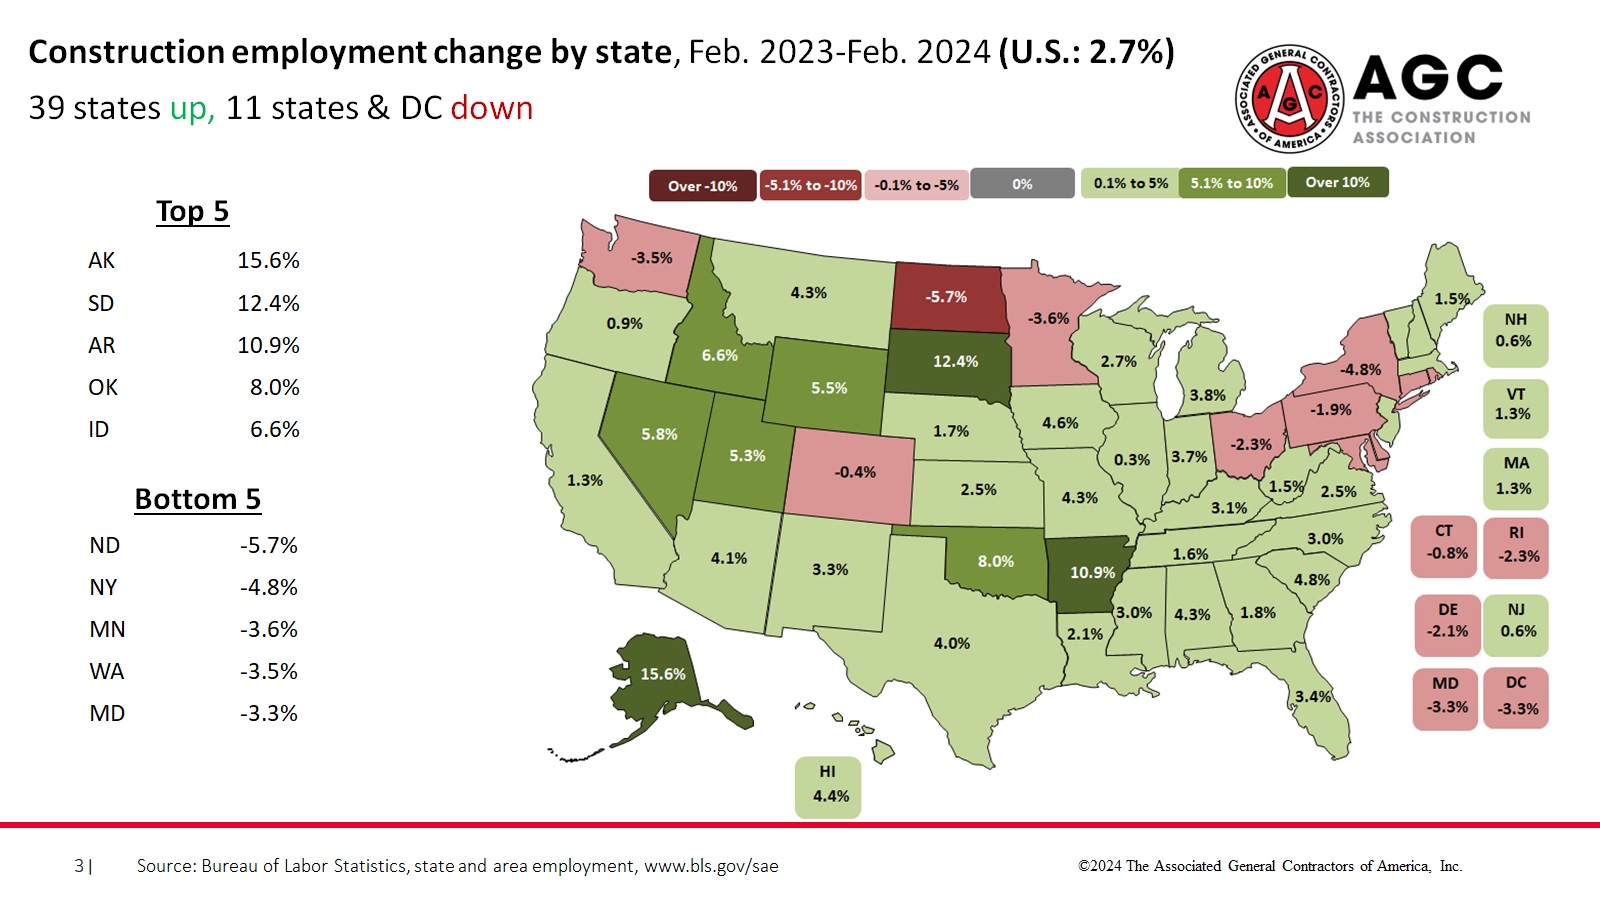
Seasonally adjusted construction employment rose from January 2023 to January in 37 states and fell in 13 states and the District of Columbia, according to AGC’s analysis of BLS data. California added the most construction employees (44,600 or 5 percent), followed by Florida (27,200, 4.4 percent), and Texas (24,500, 3 percent). South Dakota had the steepest percentage increase (11 percent, 3,100), followed by Arkansas (10 percent, 6,400), and Alaska (9.6 percent, 1,600). New York lost the most jobs (-12,000, -3 percent), followed by Washington (-8,000, -3.4 percent), and Pennsylvania (-7,200, -2.7 percent). The steepest percentage loss occurred in D.C. (-5.1 percent, -800 jobs), followed by Maryland and Washington (both -3.6 percent, -5,900). For the month, construction employment rose in 33 states, fell in 16 states, and was unchanged in Missouri and D.C. North Carolina added the most jobs (4,000, 1.5 percent), followed by Indiana (2,700, 1.6 percent). Three states led in percentage gains with 2.3 percent each: Arkansas (adding 1,500 jobs), Hawaii (900), and Mississippi (1,100). State and metro data (see below) both incorporate annual revisions to several years of past estimates. (Note: For D.C., Delaware, and Hawaii, BLS posts combined totals for mining, logging, and construction; AGC treats the changes as all from construction.)
Construction employment, NSA, rose year over year from January 2023 to January 2024 in 231 (65 percent) of the 358 metro areas (including divisions of larger metros) for which BLS posts construction employment data, fell in 83 (23 percent), and was unchanged in 44, according to an analysis by AGC. (Note: AGC treats as construction-only the totals for metros in which BLS reports only combined totals for mining, logging, and construction.)