Successful metal building energy management could be a click away
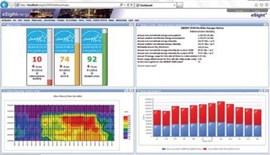
An energy management dashboard is a browser-based application independent of the metal building automation system providing rapid identification of real-time data and historical trends, including energy use, operational efficiencies and critical metrics. Most energy management software can result in energy consumption and cost savings in metal buildings between 5 to 30 percent.
“Energy dashboards enable users to view trends and be able to quickly identify issues before they become bigger problems,” says Pam Henry, sales specialist at Activelogix, Charlotte, N.C. “The different types of dashboards include custom-made graphical user interfaces with control capabilities, sustainability dashboards that have no control capability and provide information only, and dashboards like Periscope by Activelogix that provide both control capability as well as information.”
Lucid’s energy management dashboard lets people view, compare, and share building energy and water use information in real time on the web. “We work with our customers to define profile pages designed specifically for their context: for example buildings, companies or schools,” says Andrew deCoriolis, director of marketing and engagement at Lucid, Oakland, Calif. “Once monitoring is enabled, logical groups are defined such as departments, floors, dormitories or end use. Initial analysis will reveal breakdowns by floor or end use, or identifying periods of high consumption. “We believe that the best results are obtained when users can visualize energy and water usage in meaningful ways, and feel they can make a difference. To help people make sense of usage information, easy-to-digest graphs allow even non-technical people to identify trends and relationships in energy and water use data. Graphs work synchronously with resource-specific animated gauges, creating an engaging and interactive experience that keeps building occupants informed and engaged.”
10 techniques
The dashboard portion is only part of what is required by most organizations, as it is only part of an energy management software system. According to Sara Volpe, vice president of marketing and communications at eSight Energy Inc., Schaumburg, Ill., below are 10 techniques included within a dashboard that help aid companies improve energy efficiency and comfort in metal buildings:
1.) Identify key consumption areas: Install meters to pinpoint areas of energy consumption and identify high areas of usage. This allows users to target areas to undertake efficiency programs, make investments and accurately forecast ROI.
2.) Base load: Once energy consumption data is being fed into an energy management platform, one of the first places to look for savings is by monitoring energy usage during “out-of-office” periods or when the building should technically be closed. There is always a base load of energy being used by a building, but this should remain relatively constant from week to week depending on season. Identifying this usage allows users to easily and quickly spot any energy waste. There are extensive opportunities for improvements during inactive periods of the day. High-base load can often point to something as simple as the heating and cooling system not being configured correctly, and the visualization provided by a dashboard allows for the ability to address and reduce out-of-hours usage.
3.) Benchmark building performance: Benchmarking building performance provides on-going review to determine if a building is getting better or worse in comparison to itself, other buildings within the organization’s portfolio, and/ or similar buildings outside the organization. With analyses like year-on-year comparisons, energy managers can establish a starting point to track performance, provide on-going monitoring of building trends and locate properties that are getting better/worse on a relative basis; thus providing accurate justification for improvements.
4.) Carbon tracking: Convert energy usage into tons of carbon dioxide in line with E2 Grid regions, supplier-published or user-definable emissions. Conversion of energy into carbon is a powerful way to understand how to monitor and reduce carbon footprints and reduce environmental impact.
5.) Alarms: Dashboards can alert and action anomalies in data. For example, eSight’s Exception Reporting Module generates alarms for automatic distribution via email to automatically notify when energy usage data is inaccurate, steps outside of tolerance levels, deviates from a target and more. Alarming tools enable a quick reaction to rectify a problem before it has the opportunity to continue or worsen.
6.) Performance analytics: Calculate performance efficiency by analyzing consumption data versus production data to optimize efficiency and create a business case for upgrades. Set targets for reduction, monitor on-going deviation from targets and analyze total savings to date since project inception.
7.) Normalize data: When monitoring a large portfolio of a large building, the most efficient way to reduce energy is to look at the worst-performing sites and asses these first. However, it is often misleading to look at just the energy consumption of a building without taking into account a number of factors that drive the energy usage, such as season, geographical regions, time of day, square footage and occupancy numbers. With such depth of normalization capability available across your portfolio, users can view the impact of improvements with clarity over time; it provides a true “apples-to-apples” comparison.
8.) Multi-variable regression analysis: Multi-variable linear regression analysis provides realistic modeling of performance, normalizing usage against up to 10 driving factors simultaneously. This technique allows users to compare actual usage against the predicted usage based on these factors or to forecast energy usage going forward.
9.) Utility bill verification: Compare utility bill usage data and costs against collected meter data to eliminate cost of inaccurate bills and prove anomalies.
10.) Dashboards: For up-to-date information and instant reaction, energy dashboards are key to identifying areas for improvements. Dashboards are also useful for energy efficiency initiatives as they help to increase participation throughout the organization. With web-based technology, users can access energy data from anywhere worldwide. The more access and visibility employees have into energy usage information, the more likely they are to get involved in energy-saving initiatives.
 In addition to the above techniques, metal building owners may have to bill tenants based on usage. Some software can automatically manage the process of calculating energy consumption and billing sub tenants across one or more sites. This enables commercial property owners responsible for sub-tenanted properties to store different supplier contracts against sub-tenant meters. The information can then be used to automatically generate a formal sub-tenant bill based on energy usage over an annual, monthly or four-week bases.
Metal buildings with fans can benefit from energy management dashboards and software. IFAN by Kelley Co., Carrollton, Texas, networks their high volume low speed big fans and controls them from a centralized location. The fans are networked to a 21-inch touchscreen computer, complete with custom graphics representing the facility’s exact fan layout. This screen allows administrators to control fans individually, by zone and for the entire facility. The system can also display a variety of tailored performance metrics for individual fans, a particular zone or the entire facility that can be archived and viewed later for trend analysis.
Incentives and codes
Beyond the very real incentive of dashboards making customers and occupants aware of energy usage, and the obvious monetary savings, there are a variety of industry trends, incentives and motivators for performance monitoring and energy dashboards. “First, energy disclosure laws have been passed in a variety of cities, requiring that buildings above a certain size track publicly disclose energy use information,” says deCoriolis. “Building dashboards can help track and report that data.
“Secondly, the USGBC LEED scoring system for Existing Buildings, Operations, and Maintenance require ongoing performance monitoring of buildings. This ensures that LEED certified buildings continue to perform as expected and modeled. There are also credits with LEED given to buildings that use performance data to drive behavior change.”
There are several incentives offered by utility providers for reducing energy consumption. “One specific example is the Monitoring-Based Commission incentive offered by ComEd and Nicor,” says Volpe. “The incentive basically offers up to $25,000 toward implementing an energy management system for on-going energy monitoring and additional money back based on savings achieved after the software implementation.”
 Despite these incentives, accurate, real-time monitoring of energy use in buildings has been slow to develop in the United States. “ESight Energy was founded in the United Kingdom and moved to the states in 2008,” says Volpe. “We have definitely the U.K./European market as far as recognizing the importance and value of energy management software. Working with eSight Energy and in the industry for over three years now I’ve definitely seen an increase in the number of organizations and industry verticals that are now warming up to the idea.”
Sarah Erdman, marketing director at QA Graphics, Ankeny, Iowa, has seen dashboard usage increase in certain segments. “Because this solution complements existing building automation system or meters in place, it typically is implemented by organizations that are building new or retrofitting buildings. There has been a high use of our solution on projects working to achieve a green building certification. I would say that we’ve definitely seen a wider adoption of the dashboard on the coasts, whereas the Midwest has adopted the technology at a slower rate.”
With today’s technology, new opportunities are surfacing for metal buildings to boost energy savings via energy management software and dashboards. Building information is much more visual and more accessible. Lucid’s Building Dashboard Network, the first social network for buildings, allows people to view, compare and share building energy and water use information on the Internet.
 With the capability to share on-site, online and on mobile devices, energy information can be accessed anywhere, anytime. And information can be compared with other similar buildings across the country, providing opportunities for large-scale energy competitions or social communication. With this type of advanced linking and accessing, real-time monitoring of energy use in metal buildings in the United States should be become quite energetic very soon.
[sidebar]
Educate for energy savings
The best energy saving dashboards and software in the world are worthless unless people know how to use them. This knowledge must be available at all levels. Smarter metal building occupants and managers, not just smarter metal buildings or control technologies are critical elements of effective resource conservation. Dashboards do not make decisions, people do.
“A CEO can have a dashboard view that shows if energy consumption has gone up or down,” says Pam Henry, sales specialist at Activelogix, Charlotte, N.C. “An energy manager can use the dashboard to determine how to best allocate resources for maximum impact. The facilities team can use the dashboard to view real-time consumption to determine if equipment is working properly and if changes need to be made.”
Print and digital product guides and user guides are usually provided to new customers. During the customer on-boarding process, Lucid hosts a series of Web training to help customers understand the platform and develop a strategy for integrating into internal operations and programs. “Once customers are up and running, dedicated Lucid Client Consultants work with organizations to answer questions, provide additional training, and give ongoing advice and guidance on best practices for utilizing the building dashboard,” says Andrew deCoriolis, director of marketing and engagement at Oakland, Calif.-based Lucid.
ESight Energy offers several different installation, training and consultancy services to their customers. “We don’t simply provide the software to the end-client and expect them to decipher how to use the system,” says Sara Volpe, vice president of marketing and communications at eSight Energy Inc., Schaumburg, Ill. “The eSight Energy implementation team, will assist with installation, provide consultancy on system setup and best practices, as well as provide eSight energy management and administration training courses for users of the system. We also hold a user conference for our clients to come together to share knowledge, and learn how other people within their industry are using the software ‘EMS Best Practice’ sharing.”