Bottom Line-Construction spending inched up 0.1% in June. -Excluding improvements (a better measure of activity), spending increased 0.3%. -Private construction declined 0.6%, while public construction jumped 1.5%. -Private nonresidential construction fell 0.5%. Moreover, the estimates for April and May were revised down. -Single-family home construction slipped 0.7%—the first drop in 13 months. -Multi-family housing construction inched up 0.3%, the first gain in 21 months. Outlook To gauge underling trends, we prefer to deduct residential improvements from the totals. The Census does not itemize this category in the report because improvements are badly estimated. Excluding residential improvements, spending increased 0.3%. This category appears to be leveling, after dropping steadily over a two and a half year period. Single-family construction slipped 0.7% in June, the first drop in 12 months. This category will likely drop further for a few months, since it is based on a weighted average of recent single-family housing starts. Single-family housing starts fell 19% in May, 1% in June, and are likely to fall again in July. The recent drop in single-family starts is related to the second homeowners’ tax credit, which led builders to ramp up on housing starts early this year. Multi-family housing construction spending increased for the first time in 21 months. Moreover, May’s drop was revised to minus 3.7% (previously minus 6.3%). Recent evidence indicates that this sector is starting to climb out of a very low bottom. The nonresidential construction downturn shows few signs of letting up. Last month, we wrote “the revised numbers show that private nonresidential construction has leveled since February.” But data revisions to the previous revisions show that spending on this category dropped for the 15th straight month in June. Compared to a year ago, spending is down 24%. Indeed, spending on every major nonresidential category is down compared with 12 months earlier. The good news about this category is that the monthly declines are getting smaller. The bad news is that with unemployment high, credit tight, and commercial real estate loan delinquency rates rising, spending on nonresidential construction is not likely to turn around for another year. Public spending increased 1.5% because of another solid increase in infrastructure spending. Increases in infrastructure spending should keep public construction in the black for the next two years. Last week, the BEA reported that the economy grew 2.4% in the second quarter. This estimate will be downgraded by about a tenth of a percent because of June’s construction numbers.
Construction Spending Was Flat in June, and Appears To Be Leveling
This Month’s Features

MCN’s report from the Rockies
As a newbie, there is perhaps no better way to sink my teeth into the metal building industry than by attending the Annual Conference...
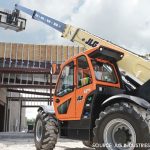
A jobsite crane isn’t always the answer
Expanding the versatility of telehandlers on metal construction jobsites is all about the different types of attachments that can be used on the front...

The smallest component, the biggest risk in metal roofing
A metal roof may be sold on longevity, but on many projects, the service life of the system is determined by one of the...

Editor’s Corner: How to choose the right safety gear in 2026
In this episode of Editor’s Corner, Anthony Capkun of Metal Construction News speaks with Cam Mackey, president & CEO of the International Safety Equipment...
Read the latest issue

July 2026