The U.S. economy and construction market have reached a tipping point. After a solid 10-year economic expansion and moderately healthy recovery in construction, total construction starts are now tipping over the edge into decline. According to Dodge Data & Analytics, total starts reached a peak at $815 billion in 2018 and will inch down 1% to $809 billion in 2019. With a potential economic storm (or at least some rain) gathering on the horizon, total construction starts are expected to decline a further 4% in 2020 to $776 billion.
A decade of expansion is nearing a point when the construction economy could change

Here’s a quick look at the highlights of the 2020 forecast:

- Single-family housing starts peaked in 2018 at 833,000 units ($230 billion), then headed 3% downward in 2019 and will drop another 5% in 2020 to a cyclical low of 765,000 units. The dollar value of single-family housing starts will slide 3% in 2020 to $217 billion after falling 3% in 2019. The single-family downturn will be mild since its recovery barely got off the ground.
- Multifamily housing starts reached a peak in 2018 at 542,000 units ($99.8 billion) and will drop 11% in 2019 and 15% in 2020 as starts fall to 410,000 units. In dollar terms, multifamily starts will slide 9% in 2019 followed by a 13% drop in 2020 to $78 billion. The multifamily downturn will be more definitive since the sector’s expansion was robust—even exceeding the previous 2005 peak.
- Commercial building starts are expected to peak in 2019 at $127 billion, although square footage peaked in 2017 at 770 million square feet (msf). In 2020, starts will slide a more pronounced 10% to 670 msf, and dollar value will fall 6% to $120 billion. Performance in commercial building has varied substantially by category— warehouses and hotels have performed exceptionally well, offices have increased moderately but stores and shopping centers have shown dismal outcomes.
- Institutional building starts peaked in 2017 at $145 billion (347 msf) as a number of massive airline terminal renovations/expansions broke ground. Starts pulled back in 2018 as activity returned to more sustainable levels. In 2019, a modest increase in the dollar value of starts will be unable to pull activity above that 2017 level. Starts will grow 2% to $143 billion, although square footage will dip 1% to 337 msf. In 2020, institutional starts will slide 4% to 323 msf, and dollar value will remain little changed at $142 billion.
- Manufacturing construction peaked in 2018 at $32.8 billion (84.7 msf) and will tumble sharply in 2019, followed by another decline in 2020. The downturn is the result of the U.S.-China tumult over trade and tariffs that has pushed the U.S. manufacturing industry into decline. After falling 16% in 2019, the square footage of starts will slide another 9% in 2020 to 64.4 msf. Dollar value will fall a steeper 29% in 2019, then drop just 2% in 2020 to $22.7 billion.
- Public works construction starts will drop 4% to $158 billion in 2019, but the downturn will be due to a sharp decline in other nonbuilding following a surge in pipeline construction. Starts will revive 4% in 2020 to $164 billion. Public works won’t yet feel the effects of the economic slowdown in 2020 because the sector is publicly funded and responds to changing economic conditions with a lag.
Residential

Housing starts are almost always at the leading edge of the business cycle because their fate is closely tied to interest rates, which the Federal Reserve Board uses in monetary policy to slow down or speed up economic growth. So, even though neither the overall economy nor the construction market has yet reached a peak, the apex for housing starts has likely already come and gone. Total housing starts on a Dodge basis reached 1.375 million units in 2018 and are expected to fall 6% in 2019 to 1.290 million units. The dollar value of starts will pull back 5% this year to $314 billion after reaching a peak at $330 billion in 2018. Both the single-family and multifamily housing segments attained their peaks last year. Single-family housing starts reached 833,000 units in 2018, while multifamily units hit 542,000. This year, singlefamily housing starts will pull back 3% to 805,000 units ($223 billion), while multifamily starts will see a steeper 11% decline to 485,000 units ($91 billion). In 2020, housing starts will decline more decisively as economic growth softens further. The downturn in housing is expected to last two years with total residential starts falling to a low of 1.175 million units ($295 billion) in 2020. Singlefamily housing starts will drop 5% next year to 765,000 units ($217 billion), while multifamily housing will fall another 15% in 2020 to 410,000 units ($78 billion).
Single Family

In 2018, the economy and single-family housing remained healthy, but both began to show signs of their advanced age. This year, economic growth has begun to slow, the construction cycle’s pinnacle is at hand, and single-family housing starts are already heading downward. Even though single-family housing starts rose over the year in 2018, seasonally adjusted annualized starts peaked in the first quarter at 845,000 units. By the first quarter of 2019, starts had pulled back 8%, and in three of this year’s four quarters (all except the third) starts are expected to be lower than their yearearlier level—a clear signal that this year’s total will be down from last. For fullyear 2019, single-family housing starts are expected to drop 3% to 805,000 units and the dollar value of starts is expected to be 3% lower at $223 billion.
Multifamily
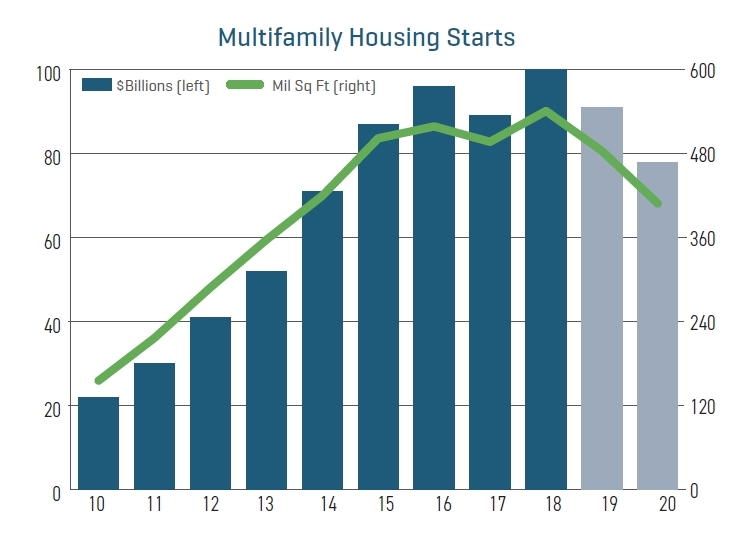
Multifamily housing starts have been a powerhouse of strength throughout the construction recovery and reached 542,000 units in 2018, up 298% from the 2009 bottom of the cycle. The dollar value of multifamily starts reached $100 billion in 2018, up an even more impressive 443%. But last year was the pinnacle of the current cycle and starts are expected to decline both this year and next. This year, slower economic growth will prove to be a drag on multifamily housing and starts are expected to fall 11% to 485,000 units. Dollar value is expected to drop 9% to $91 billion. Despite the pullback, levels of multifamily construction will remain robust. Starts will continue to decline in 2020 when they slip another 15% to 410,000 units ($78 billion). Declines, however, will be limited by favorable demographic trends and recent tax changes that will keep multifamily housing a favorite of the investor community.
Commercial

Commercial construction, like housing, typically turns early in the business cycle. And, like housing, the peak for commercial construction has already come knocking. The square footage of commercial construction starts actually peaked in 2017 at 770 msf, while the dollar value of those starts (before adjusting for inflation) is expected to peak this year at $126.6 billion. Commercial construction starts are expected to slide 2% this year to 741 msf (4% below the 2017 peak), while dollar value will gain 3%. In 2020, commercial starts will decline in both square footage and dollar value as the economy softens after a decade of expansion. Commercial square footage will decline 10% in 2020 to 670 million square feet, and dollar value will drop 6% to $119.5 billion.
Stores and Shopping Centers

The recovery in construction for stores and shopping centers (retail) fell far short of expectations, and starts are once again on the decline. Starts grew to a cyclical peak of 118.6 msf in 2014 (just 46% higher than the deep 2010 trough) but then declined through 2018 when they fell 16% to 81.4 msf, roughly equal to the trough resulting from the Great Recession. In terms of dollar value, starts peaked in 2016 at $21.1 billion and then pulled back in both 2017 and 2018 to just $17.0 billion.
Commercial Warehouses

The groundswell in warehouse construction starts during the current economic expansion is directly related to the dearth of retail projects. Warehouse starts fell to a historic low of just 49 msf in 2010 but increased by double-digit rates for seven straight years from 2011 through 2017, resulting in an amazing 510% increase over that time and reaching a cyclical peak of 299 msf in 2017. For all this growth, however, the average number of square feet added each year since 2010 was 15% lower compared to the previous (2000–2009) decade—179 msf compared to 210 msf.
Office Buildings

The main driver for office construction is office employment, so construction activity has always been closely tied to economic ups and downs. Following the Great Recession, economic growth and employment recovered at a slow but steady pace, and gains in office construction played out accordingly. From the bottom in 2010 through 2018, office starts climbed 140% in square footage to 137 msf and 186% in dollar value to $48.2 billion.
Hotels and Motels

During the current, hotel construction starts have preformed more like the warehouse sector than the retail or office sectors. Hotel starts quickly shot out of the gate following the recession and have seen remarkable growth during the recovery. From the deep bottom in 2010, hotel construction starts soared 368% through 2018 to reach just under 80 msf. During the same period, the dollar value of hotel starts skyrocketed 440% to $19.1 billion in 2018.
Institutional Buildings
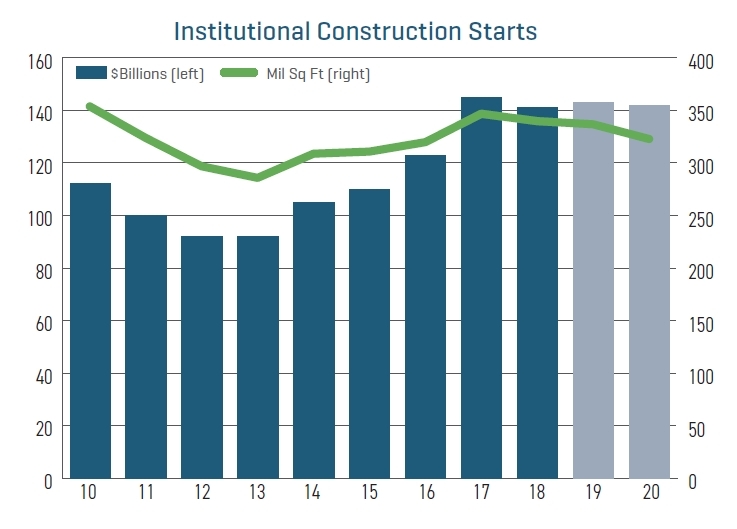
Institutional building includes a diverse group of structure types; from schools and hospitals to airline terminals and enclosed sports arenas. The common thread linking these structures is that to some degree they all rely on public funding. The stabilizing influence of public funding also results in a lagged relationship with the overall business cycle. While the Great Recession ended in 2009, the dollar value of institutional starts didn’t reach bottom until 2012, and square footage reached a cyclical low in 2013. Starts rose rapidly in the aftermath. And although they pulled back in 2018, the decline was the result of a large pullback in transportation following 2017 groundbreakings on massive projects at both LaGuardia International Airport and Los Angeles International Airport. In 2020, institutional starts will increase 2% to $142.7 billion, although square footage will slip a slight 1% to 337 msf. The dollar value of starts will remain essentially flat in 2020 at $142.5 billion with square footage declining 4% to 323 msf.
Educational

In 2018 education building starts increased a strong 8% to $62.9 billion and square footage moved 3% higher to 140 msf. Strength was most evident in 2018 in the K–12 side of the market, with senior high school starts rising 24% to $17.3 billion and primary/junior high schools jumping 14% to $21.8 billion. Combined, K–12 construction accounted for 62% of all education construction starts in 2018. However, weakness plagued college and university construction, with starts moving 23% lower to $10.2 billion. Laboratory, library and museum activity rose a combined 14% to $8.6 billion.
Health Care Buildings

Health care construction starts reached a new high at 110 msf in 2006 but have not come near that level since, falling to just 68 msf in 2009. In 2019, health care starts are expected to remain near the bottom as starts drop 6% to 76 msf but dollar value edges up 1% to $27.6 billion. Through the first nine months of 2019, starts for clinic and nursing home facilities continued to grow, while hospital buildings pulled back. The largest health care construction projects were hospitals including the $500 million MetroHealth Hospital in Cleveland. The largest clinic to break ground was the $450 million Joan Paul Rubschlager Rush Cancer Center in Chicago. In 2020, square footage is expected to pull back another 3% to 74 msf, while dollar value inches up 3% to $28.6 billion.
Transportation Buildings

Transportation building starts have been robust over the last several years, holding at or above $10 billion dollars since 2016. In 2017, starts rose 127% to $21.6 billion, and square footage rose 35% to 30 msf as major projects got underway at LaGuardia International Airport and Los Angeles International Airport. Starts tumbled 40% in 2018 but, at $13.0 billion, remained well above historic norms thanks to two multibillion-dollar projects that broke ground—the $2.1 billion reconstruction project at Denver International Airport and the $1.4 billion Terminal One project at Newark International Airport.
Recreation Buildings

In 2018, recreation building starts increased 12% to $20.2 billion, and square footage moved 3% higher to 49 msf. Convention centers were the driving force last year with work getting underway on an $860 million expansion of the Las Vegas Convention Center and a $764 million expansion of the Washington State Convention Center in Seattle. The $1.3 billion Las Vegas Raiders Arena in Las Vegas also started last year.
Public Buildings

Public building construction includes capitols and courthouses, police, fire, detention and other public administrative facilities. In 2018, the sector reversed course from an accelerated pace in 2017 as square footage contracted 1% to 19.5 msf and the dollar value of construction moved 1% higher to $9.7 billion. The recovery in public building construction has had a hard time finding its footing with starts rising for a year or two before suffering setbacks. This pattern is expected to continue in 2020 as starts rise 5% to 20 msf and 8% to $10.5 billion to reach a cyclical peak. This will mark the first time in nearly a decade that dollar value for public building construction surpasses $10 billion.
Manufacturing Buildings

In 2018 manufacturing starts rose 19% to 85 msf (the highest level of starts since 2007) as several projects with large footprints broke ground such as the Egger Wood Products plant in Lexington, N.C., and the Braidy Industries Aluminum Rolling Mill in Ashland, Ky. The dollar value of starts, meanwhile, grew 25% to $32.8 billion. In 2018, 47 projects valued at $100 million or more reached groundbreaking led by one very large, unique project: the U.S. Department of Energy’s $6.5 billion uranium processing facility in Oak Ridge, Tenn., which will support the nation’s nuclear weapons stockpile and provide uranium fuel for U.S. Navy submarines and aircraft carriers.
Richard Branch is chief economist for Dodge Data & Analytics (formerly McGraw Hill Construction). His primary focus is to ensure Dodge’s preeminence in tracking, analyzing and forecasting construction activity and to work closely with national, regional, and trade media to share this insight. He is an industry veteran with 20 years of experience as an economist at various consulting and publishing firms, and is well versed in helping organizations gain the insight they need to enhance their profitability.